I'm thrilled to announce that we have finished our new dashboard! After countless hours of going back and forth, designing, testing, iterating, and testing again, our improved admin panel is now finally live! You can see it for yourself once you log in to your account over at admin.bitninja.io.
You might ask: What changed?
A lot. 😃 Let me explain.
The most important part, YOUR experience using it. We heard you loud and clear and decided to finally implement features that have been long overdue. So, we have spent a considerable amount of time perfecting this. Our goal was to make it as streamlined as possible, for every user, regardless of how many servers you manage, we've got you covered. You might be familiar with our two different options, table, and grid views, however from now on, we will recall your last choice, so the days of endlessly choosing table view are finally over. As part of the UX overhaul, we have also improved the management of server groups, and their members. Adding or removing servers from a server group is now much easier both in a grid:

And in table views:

Additionally, we have added some extra bit of functionality to the table view. Now, the modules column will show you which modules are disabled when you hover your mouse over for some quick information.

The new UI provides an at-a-glance panel, where you are able to see the most important metrics about your servers' security. But we didn't stop there. You are no longer limited by fixed ranges and data points. You can browse through a lot of different metrics, such as blocked incidents, malware numbers, DOS attempts, and many more. Navigating through your server groups, you will see the charts change and evolve, as now you have the freedom of checking data filtered for any of your server groups. To provide even more granularity, we have also included a date range selector that memorizes the last used range. Smart!
The appearance and behavior of the server cards have been revised too. We wanted them to be more informative, without being too overwhelming. It has all the modules listed, with their respective statuses. It can also indicate if a module is unable to start due to an outdated agent version!
Drumroll! 🥁
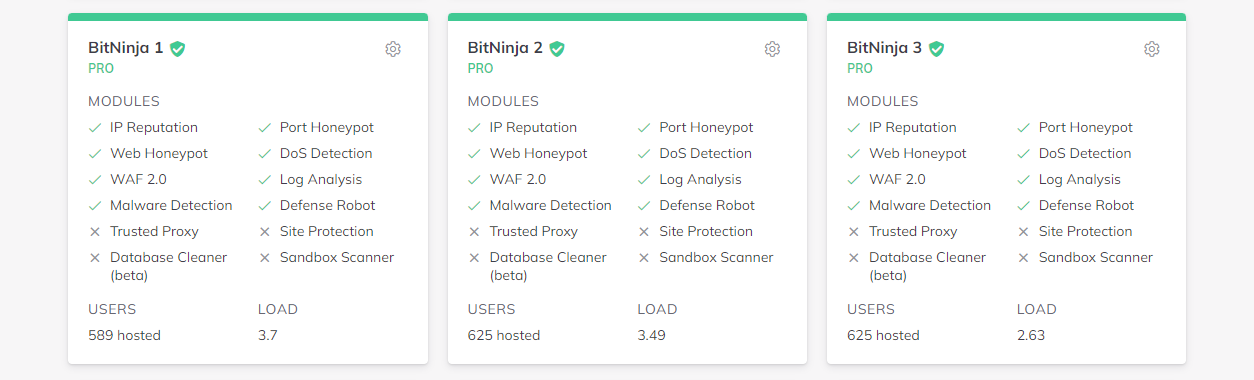
We hope you will love it just as much as we do! I know what you're thinking... "Mark, it's all good, but what about the individual servers?" - Worry not, I've got you covered!
When you click on the server card, you will be greeted by the individual server screen which went through a complete overhaul. Looking and working better than ever. The first thing you will see is a similar chart to what you find in the group view. The difference is that this one is only showing you data for the individual machine you are interacting with.
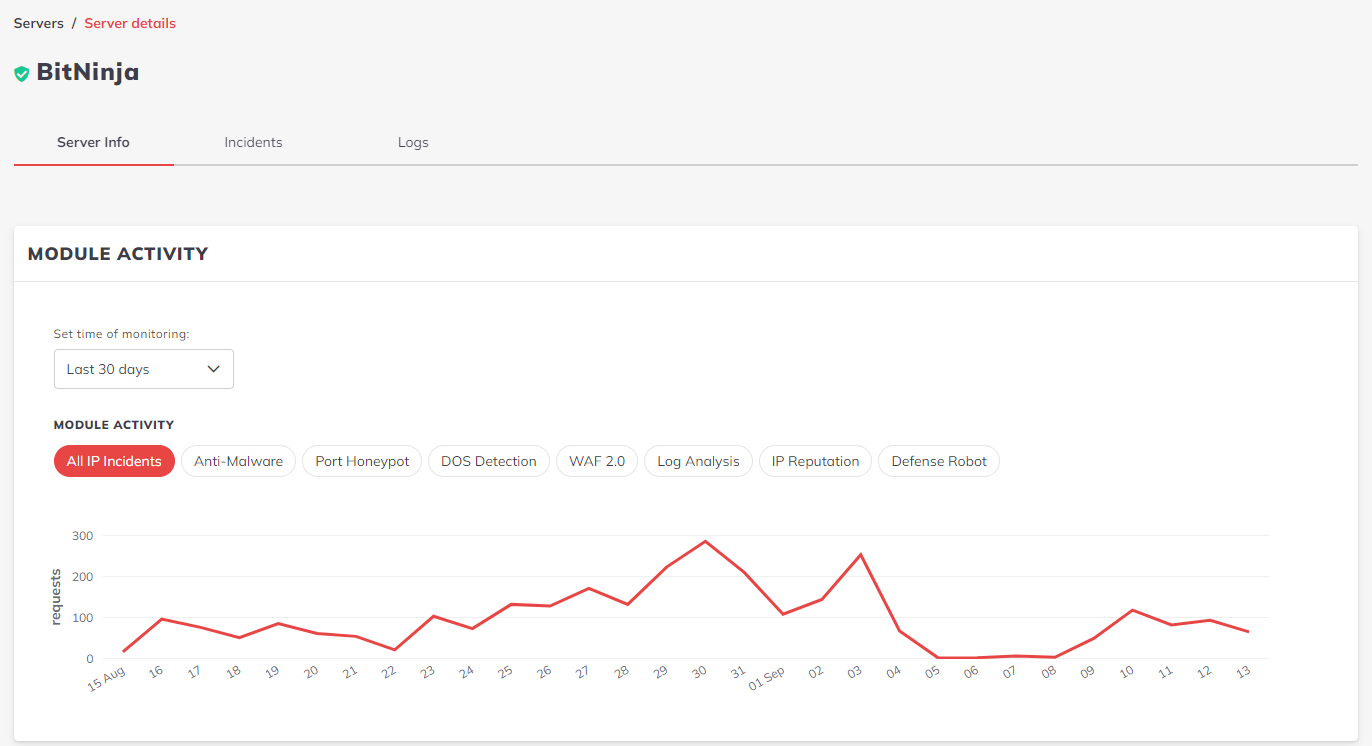
This screen is especially helpful in identifying problematic machines or simply just providing you with incident trends. Uh-oh! A wild world map has appeared, what will you do?
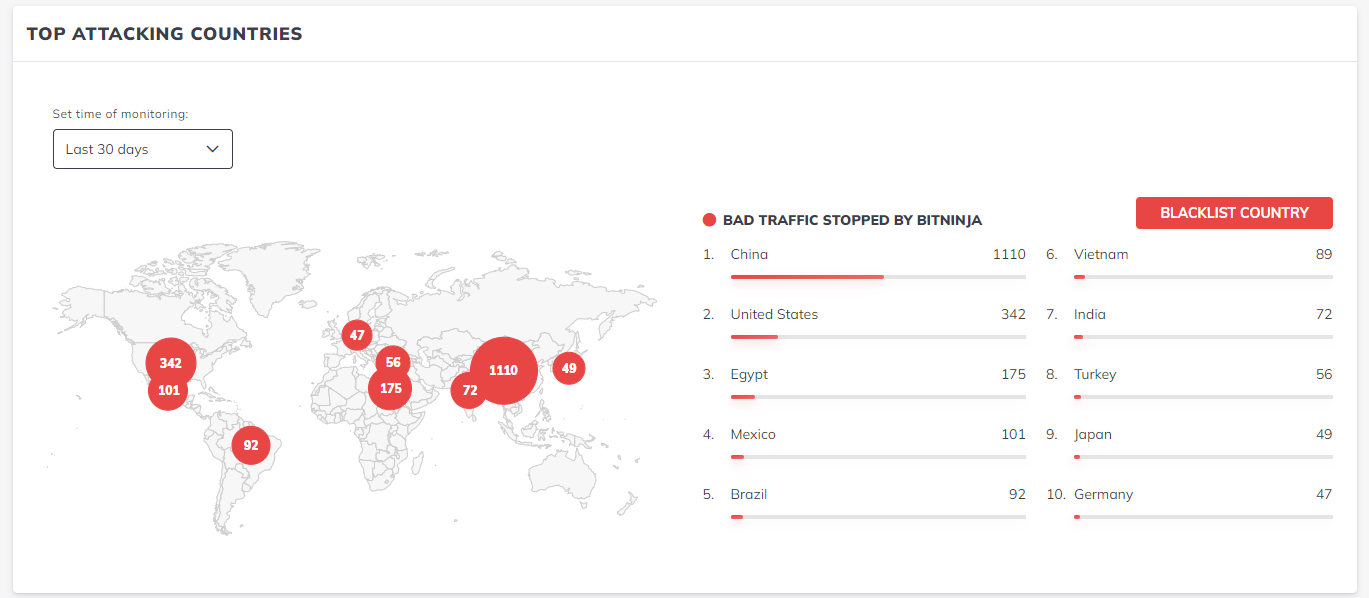
Don't flee! It could come in handy if you ever find yourself in a pinch. Imagine the scenario: an unusually high amount of blocked requests flooding in from country X where you never conduct any business, and you don't want to waste any resources on handling them. Even though BitNinja is stopping these requests, they still might increase load a bit, if we are talking about 10-20.000 requests over a short period of time. Stop them by blacklisting the country for an hour or two. With great power comes great responsibility, as it's such a drastic step, it's advised to take caution when deciding on blocking a country.
Continuing our way downwards, we reach our final destination. Packets from greylisted IP addresses are presented to us.
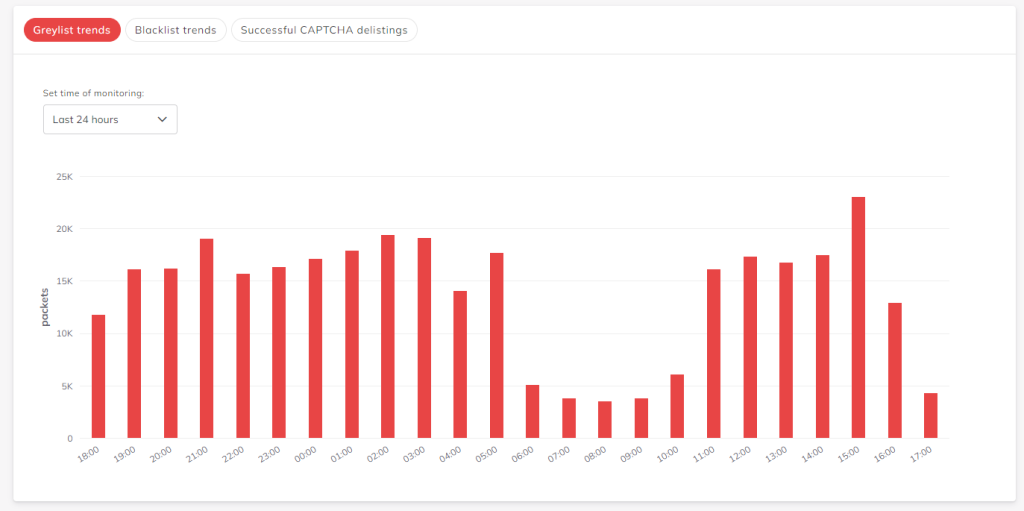
You can also filter for blacklisted packets, and even check how many people filled the CAPTCHA out properly. Pretty interesting stuff if you are the data crunching type!
We can't go past the numerous behind-the-scenes upgrades we have made as part of this project. Making the dashboard more responsive despite the sheer amount of data was no easy feat. To resolve this, we made new microservices providing the UI with quick responses. This amounts to an overall faster dashboard. We have also made some clever logic, that will cache the data for the charts once you have checked them, and only refresh if we present outdated information, or when you re-log.
We have had busy weeks, some sleepless nights, and lots of coffee, but we think it was well worth it! The improved UX provides new benefits despite the number of servers you manage. Providing you with meaningful, trackable data while being more responsive on a bad day than the old one was on a good day! Enjoy our new dashboard!
We still have a long way to go before every part of the dashboard is as optimized as we would like them to be. If you have any suggestions on how we could make it even better, don't hesitate to let us know by directly sending us a mail at info@bitninja.io📧 or by opening a feature request here. 🙋