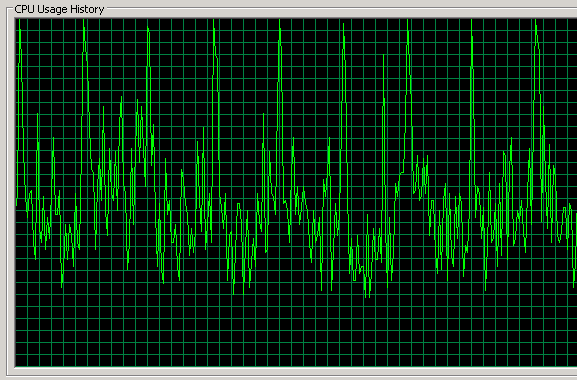
What is the average load in Linux?
The load is a measure of the amount of computational work that a computer system performs.
The Linux generates a metric of three average load numbers in the kernel which the user can easily query by running the uptime command. The three values of load average refer to the past one, five, and fifteen minutes of system operation.
Each process using or waiting for CPU increments the load number by 1, however, Linux also includes processes in uninterruptible sleep states (waiting for I/O activity).
For example, if you have an eight-core CPU, and the load average is 7.42, it indicates that there were, on average, of course, 7.42 processes ready to run, and each could have been scheduled into the CPU.

My CPU is burning, what should I do?
You can check your computer with many tools, such as top, iotop, vmstat, iostat, nload, etc. Now, we will show you the top four.
The top program provides a dynamic real-time view of a running system. It can display system summary information as well as a list of processes or threads currently being managed by the Linux kernel.
Here is an abridged output:
top – 13:51:49 up 3 days, 21:59,  2 users,  load average: 0.00, 0.01, 0.05
Tasks: 117 total,   1 running, 116 sleeping,   0 stopped,   0 zombie
%Cpu0  :  0.0 us,  0.0 sy,  0.0 ni,100.0 id,  0.0 wa,  0.0 hi,  0.0 si,  0.0 st
%Cpu1  :  0.0 us,  0.0 sy,  0.0 ni,100.0 id,  0.0 wa,  0.0 hi,  0.0 si,  0.0 st
%Cpu2  :  0.0 us,  0.0 sy,  0.0 ni,100.0 id,  0.0 wa,  0.0 hi,  0.0 si,  0.0 st
%Cpu3  :  0.0 us,  0.0 sy,  0.0 ni,100.0 id,  0.0 wa,  0.0 hi,  0.0 si,  0.0 st
KiB Mem:   2049648 total,  1119600 used,   930048 free,   148616 buffers
KiB Swap:  1046524 total,    38756 used,  1007768 free.   803064 cached Mem

PID USER      PR  NI    VIRT    RES    SHR S  %CPU %MEM     TIME+ COMMAND
30722 root      20   0   34552   3268   2752 R   1.5  0.2   0:00.01 top
1 root      20   0   29340   4236   2256 S   0.0  0.2   0:08.33 systemd
2 root      20   0       0      0      0 S   0.0  0.0   0:00.00 kthreadd
3 root      20   0       0      0      0 S   0.0  0.0  71:28.32 ksoftirqd/0
5 root       0 -20       0      0      0 S   0.0  0.0   0:00.00 kworker/0:0H
7 root      20   0       0      0      0 S   0.0  0.0  12:31.31 rcu_sched
8 root      20   0       0      0      0 S   0.0  0.0   0:00.00 rcu_bh
9 root      rt   0       0      0      0 S   0.0  0.0   0:05.08 migration/0
10 root      rt   0       0      0      0 S   0.0  0.0   0:07.49 watchdog/0
11 root      rt   0       0      0      0 S   0.0  0.0   0:09.43 watchdog/1
12 root      rt   0       0      0      0 S   0.0  0.0   0:05.58 migration/1
13 root      20   0       0      0      0 S   0.0  0.0  28:06.98 ksoftirqd/1
You can check the CPU usage by the user or the system, or shoes that the CPU is mostly waiting for I/O (wa).
The memory usage can be found below the CPU usage, where you see your total memory (and usage), free memory, and buffered memory. If you have swap partition or file, you can see that in a different row.
If the CPU usage is high, you can check which process eats your CPU up, write it PID and kill it with kill command. Or if the Wait Average is high, you know that the CPU is waiting for Input/Output, and you will use the next command, iotop.

Which process uses the swap?
You can check with this simple script which process eats up the most swap space:
for file in /proc/*/status ; do awk ‘/VmSwap|Name/{printf $2 ” ” $3}END{ print “”}’ $file; done | sort -k 2 -n -r | lessFor example, the output is:
sssd_be 1199292 kB
inotifywait 277324 kB
memcached 35420 kB
sssd_nss 34484 kB
mysqld 29472 kB
iotop watches I/O usage information output by the Linux kernel (requires 2.6.20 or later) and displays a table of current I/O usage by processes or threads on the system.
Total DISK READ:       5.47 M/s | Total DISK WRITE:    1240.01 K/s
TID  PRIO  USER     DISK READ  DISK WRITE  SWAPIN     IO>    COMMAND
11105 be/4 www-data    0.00 B/s    0.00 B/s  0.00 % 99.99 % apache2 -k start
4669 be/4 www-data    0.00 B/s    0.00 B/s  0.00 % 99.99 % apache2 -k start
13347 be/4 www-data    0.00 B/s    0.00 B/s  0.00 % 99.99 % apache2 -k start
1503 be/4 root        0.00 B/s    0.00 B/s  0.00 % 99.99 % [flush-8:0]
18035 be/4 www-data    0.00 B/s    0.00 B/s  0.00 % 99.99 % apache2 -k start
4026 be/4 mysql       2.29 M/s    0.00 B/s  0.00 % 99.11 % mysqld –basedir=…
15398 be/4 www-data    0.00 B/s    0.00 B/s  0.00 % 78.14 % apache2 -k start
4130 be/4 www-data    0.00 B/s    0.00 B/s  0.00 % 78.13 % apache2 -k start
4166 be/4 www-data    0.00 B/s    0.00 B/s  0.00 % 78.10 % apache2 -k start
4689 be/4 www-data    0.00 B/s    0.00 B/s  0.00 % 70.73 % apache2 -k start
30089 be/4 www-data    0.00 B/s    0.00 B/s  0.00 % 70.71 % apache2 -k start
16023 be/4 www-data    0.00 B/s    0.00 B/s  0.00 % 70.71 % apache2 -k start
11193 be/4 www-data    0.00 B/s    0.00 B/s  0.00 % 70.70 % apache2 -k start
12847 be/4 root        2.82 M/s    0.00 B/s  0.00 % 37.47 % rsync –no-detach
120 be/4 root        0.00 B/s    0.00 B/s  0.00 %  5.73 % [kswapd1]
You could see that some processes have high Wait Avarage, and to solve it, you need to check the Disk Read/Write with iotop. The iotop output shows you which process waits for I/O and which reads or writes with actual speed.
If you want accumulated I/O instead of bandwith, use –accumulated option with iotop.
vmstat reports information about processes, memory, paging, block IO, traps, disks and CPU activity.
procs ———–memory———- —swap– —–io—- -system– —-cpu—-
r  b   swpd   free   buff  cache   si   so    bi    bo   in   cs us sy id wa
1  1 1961476 944032 1044568 8092380    0    0    88    61    0    0 10  3 85  1
The interesting columns for you (of course, all columns are relevant) are r, b, and so.
The descriptions of the columns:
- r: The number of processes waiting for run time.
- b: The number of processes in uninterruptible sleep.
- so: Amount of memory swapped to disk.
If you have such processes that will wait more and more to get CPU time than the system will be less responsive.
If the so is high, than your memory is frequently swapped out to disk, which means you do not have enough memory to serve the processess it needs.
The last one is iostat, which is used for monitoring the system input/output device. Loads by observing the time duration of active devices, in relation to their average transfer rates. The iostat command generates reports that can be used to change system configuration to be able to balance better the input/output load between the physical disks.
Linux 3.2.0-4-amd64       2016-07-29      _x86_64_        (24 CPU)
avg-cpu:  %user   %nice %system %iowait  %steal   %idle
9,55    0,42    3,44    1,31    0,00   85,28
Device: rrqm/s wrqm/s r/s w/s rkB/s wkB/s avgrq-sz avgqu-sz await r_await w_await svctm %util
sda 0,20 103,56 17,26 90,60 572,41 1266,37 34,09 0,05 1,93 4,95 1,36 0,76 8,18
sdb 4,21 11,02 55,02 6,82 1529,15 187,23 55,51 0,12 1,96 1,80 3,26 0,76 4,71
You can drop the iostat in “monitor” mode if you put a number after the command. With one additional number, you can specify a count number,with which you limit the output of iostat.
The relevant information from these for us are avg-cpu information and the device’s tps column.
The avg-cpu tells our CPU’s Utilization Report, which contains the percentage of CPU utilization that the CPU or CPUs were idle during I/O request (iowait), executing at the system level (system) or user level (user), or the CPU or CPUs were idle (idle).
For more information about CPU Utilization>>>
The tps indicates the number of transfers per second that were issued to the device. (IOPS) By examining it, you can have an idea of how much IO you typically do, and can check it if you experience issues. You will see whether you are doing 10x of that or only getting 1/10 from the disks. Then, you have a good candidate explanation for it.

